Experiment Dashboard
The dashboard lists all experiments of your account. Here you create new experiments, find existing ones and start, check and evaluate them.
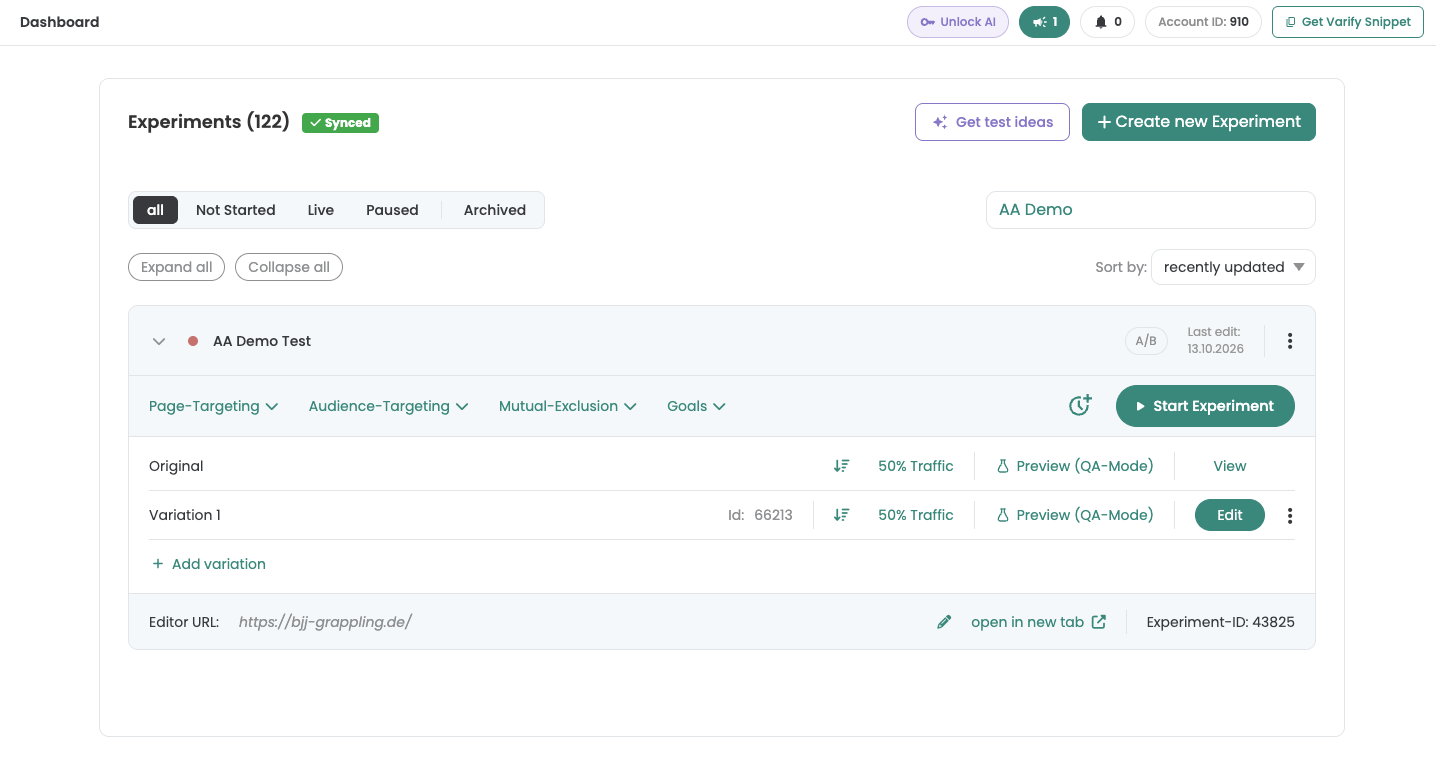
- Account ID — Shown at the top right of the header bar. Each Varify account has its own account ID. In Agency Accounts, the ID is individual for each client.
- Get Varify Snippet — The button at the top right of the header bar shows your Varify snippet. Add it to your website to start testing. Learn more
- Create new Experiment — Click this button to set up a new experiment.
- Status tabs — Filter your experiments by status: all, Not Started, Live, Paused or Archived.
- Search — Search for an experiment by its ID, name or URL.
- Sort by — Sort your experiments, for example by the last update.
- Expand all / Collapse all — Open or close the details of all experiments at once.
- Experiment name and status — Here you will find the name of the experiment. The status dot next to it shows you whether your experiment is active or not. Click the arrow to open its details.
- Targeting tabs — Page-Targeting, Audience-Targeting, Mutual-Exclusion and Goals define where, for whom and alongside which other experiments your experiment runs and what it measures. Page targeting, Audience targeting, Mutual exclusion
- Start/Pause button — Start or pause your experiment with this button. You can start an experiment as soon as a page targeting has been stored. Learn more
- Variations — Each variation shows its share of the traffic. „Edit“ opens a variation in the editor, „Add variation“ adds another one.
- Preview (QA-Mode) — Check a variation before your experiment goes live. Learn more
- Results button — If you use the Varify In-tool evaluation, you will find your test results here. The button appears as soon as the experiment has been started. Learn more
- Three-dot menu — Further actions for the experiment, for example archiving it. Learn more
- Editor URL and Experiment-ID — At the bottom of each experiment: the page the editor opens, and the ID of the experiment.