Segment-based evaluation in GA4
**IMPORTANT NOTICE:** The procedure for evaluating results in GA4 has changed slightly. The previous evaluation still works as usual.
However, the new procedure is necessary to use the upcoming GA4 evaluation directly in Varify.io. If you have any questions, please contact our Support.
In short
Once you have connected Varify.io® to GA 4, you can evaluate your experiments directly in GA 4. Use the exploratory data analysis.
Step-by-Step Tutorial
Segment-based evaluation in GA4
This is how you proceed with the analysis
Create segments for variants
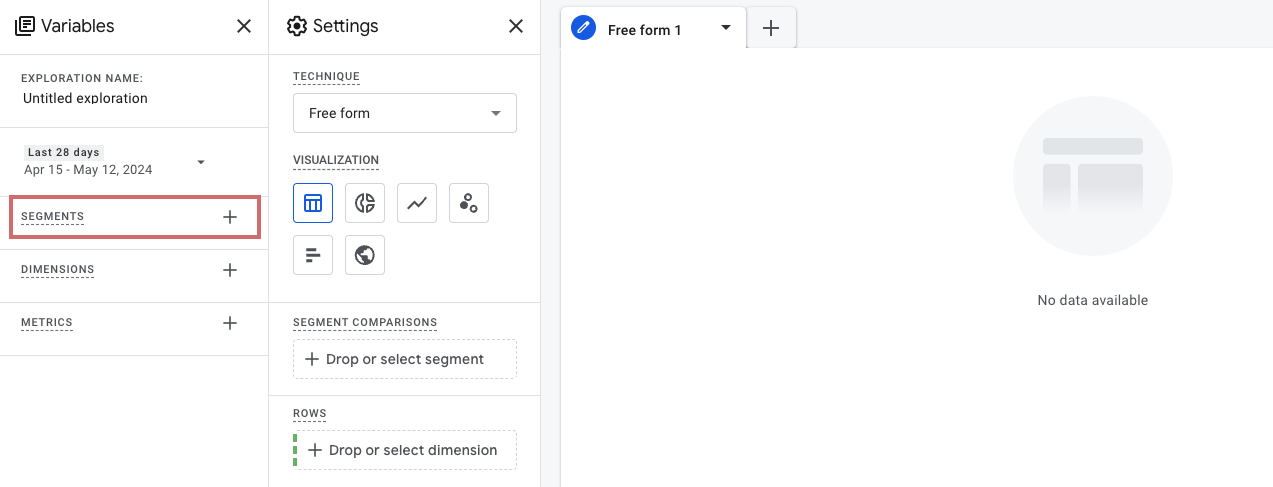
Open the exploratory data analysis and add a separate segment for each variant of an experiment you want to evaluate in this "exploration". To do this, click on "Segments +" in the left column, below the date range.
Then click on "User segment" in the "Create user segment" area. You can then specify which values the segment should display.
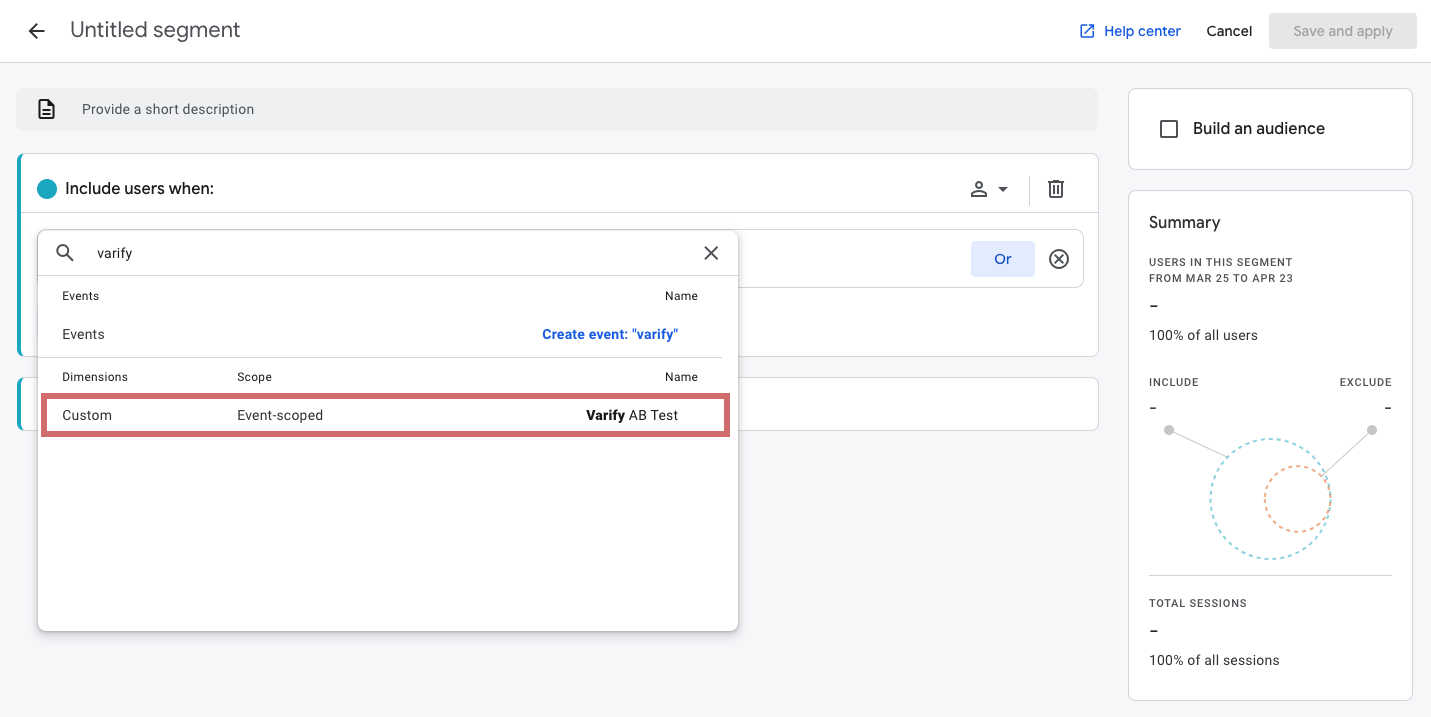
Under "Add new condition" you can select the user-defined dimension "Varify AB Test". (If you have named the dimension differently, select it accordingly).
Now add a filter that only includes users of the original participants or experiment participants.
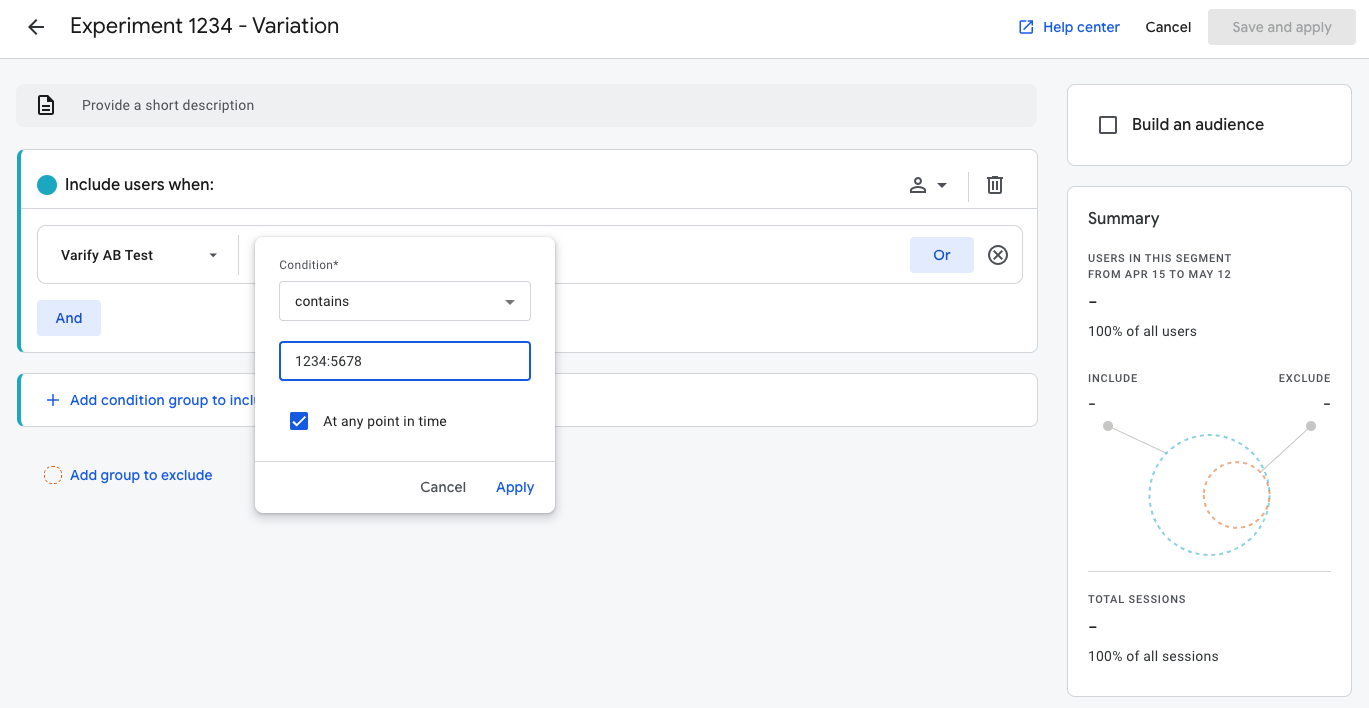
To do this, click „Add Filter“ and then select „contains“ as the condition.
Now filter for your experiment by entering the experiment ID.
- Example of an original segment: „1234:Original“ („Original“ refers to the original version > „Experiment ID:Original„)”
- Example of a variant segment: „1234:5478″ (The number after the colon stands for the variant ID > "Experiment ID:Variant ID„)”
Make sure the „At any point in time“ option is selected.
Ideally, you name the segment so that you start with the experiment ID, followed by original or variant. This will make it easier to find in your segments. Then save the segment.
For experiments with multiple variants, you must create a separate segment for each variant.
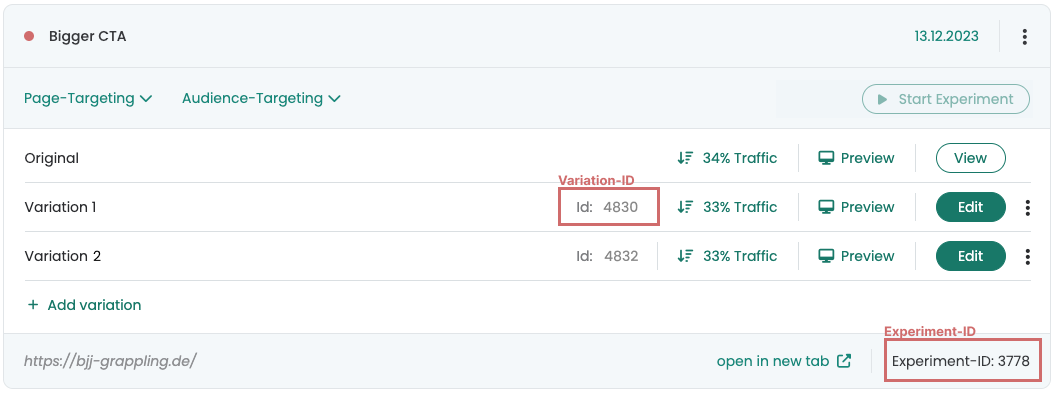
You can find the experiment ID of the experiment you want to evaluate at the bottom left of the experiment in the Varify.io dashboard or in the variant overview.
The variant ID is located in the dashboard in the respective line of the variant.
Move segments and metrics to the Settings column
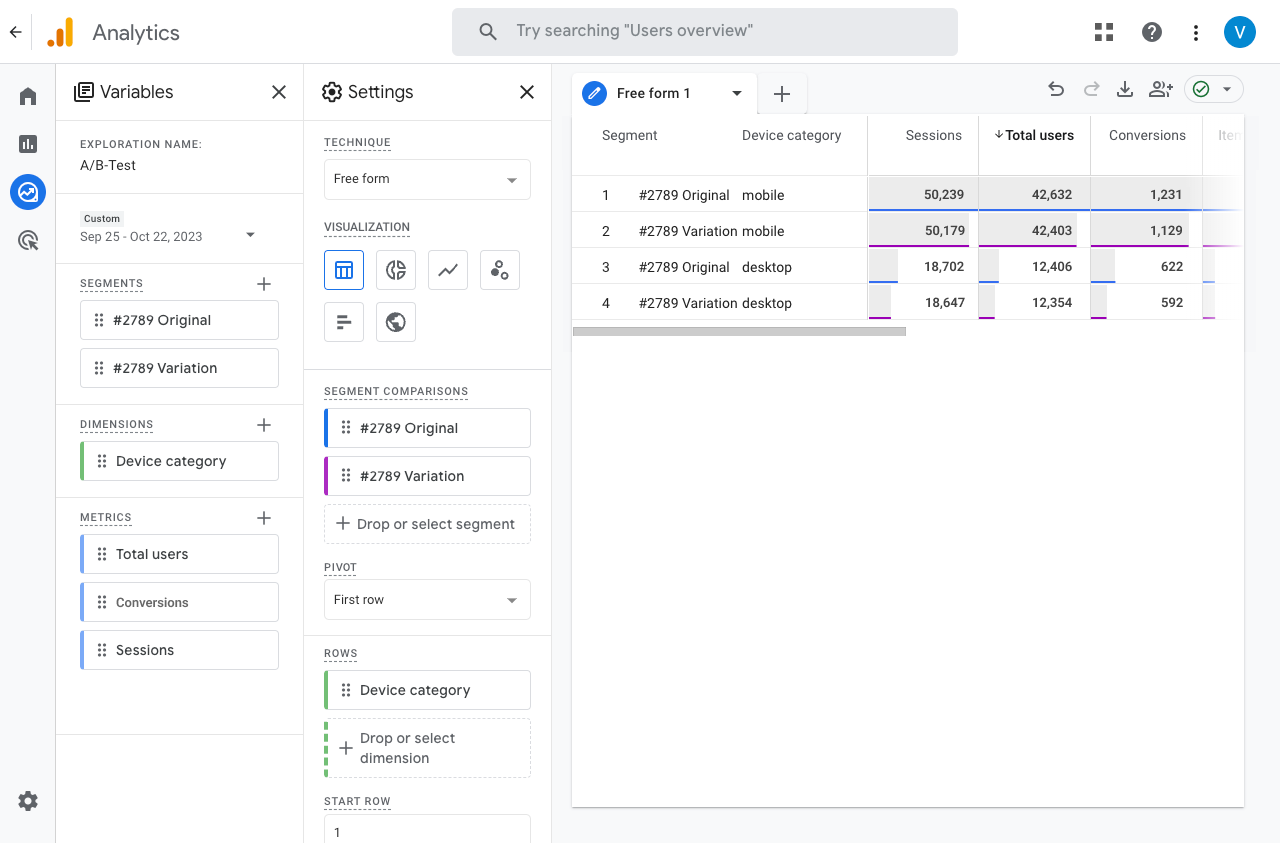
After you have created all the segments for the variations of your experiment, you can add them as segments in the Exploratory Data Analysis. Now you just need to add the metrics you want to look at in comparison between original and variation. In addition, you can also add dimensions, for example, to view traffic by different device types - desktop, mobile, traffic.
Test results for significance
Check your A/B test results for significant differences. For this purpose Varify.io provides a significance calculator. Go to significance calculator