Start an A/A test and check the tracking
In short
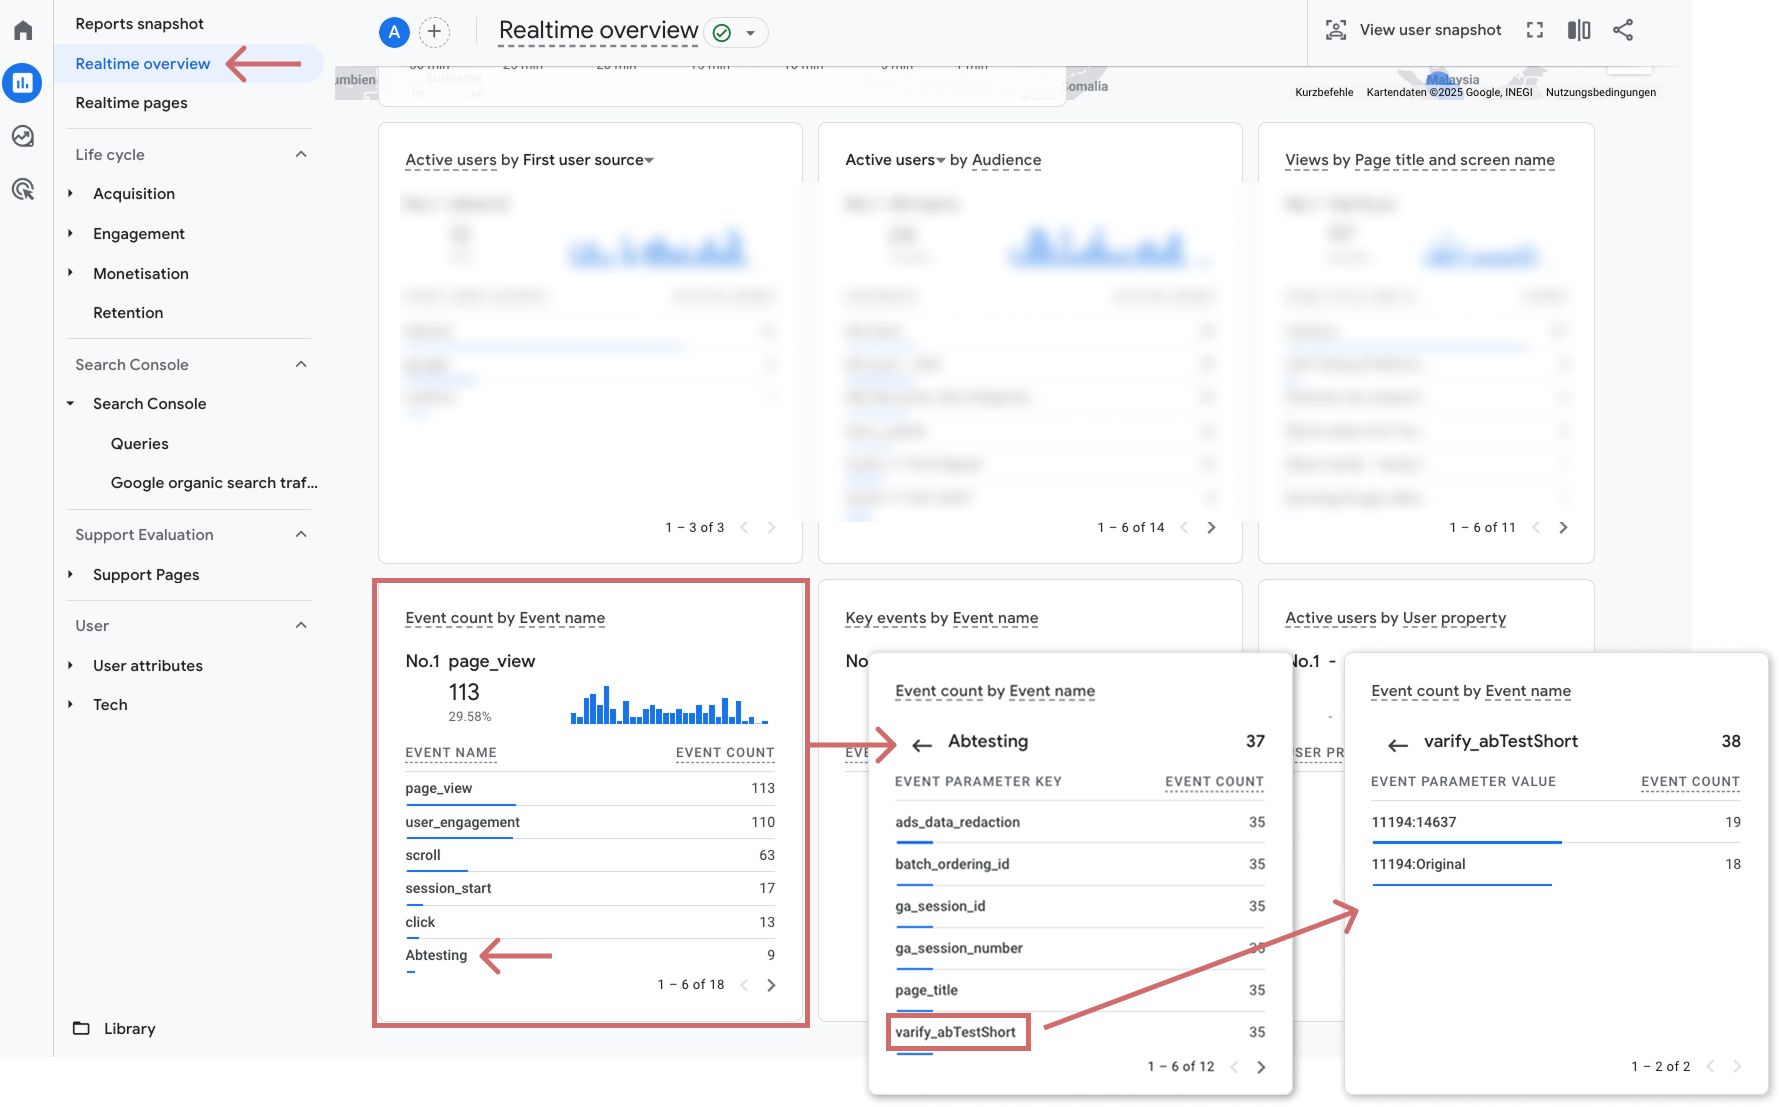
To check your tracking setup in GA4, go to the real-time report and search for the "Abtesting" event. Click on it and check if the parameter "varify_abTestShort" is present. By starting an A/A test. If the event is missing, check the integration of the Varify snippet and the tracking settings.
Step-by-Step Tutorial
Create A/A test and test tracking
1. Create A/A test
An A/A test works like an A/B test and assigns users two variants - without any actual visible changes. This allows you to test the tracking setup optimally.
Prerequisite:
The Varify code snippet must already be integrated into your website and the tracking set up.
- On the dashboard, click „Create new Experiment“
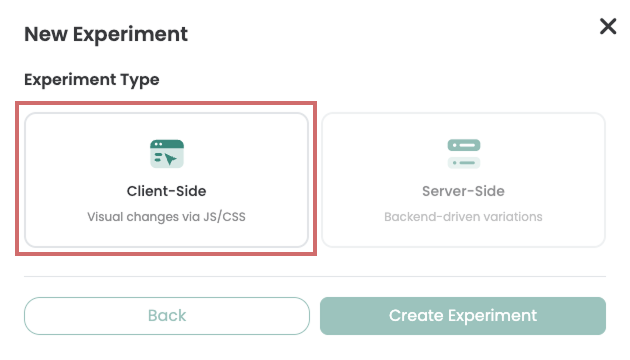
- Then select „Client-Side“
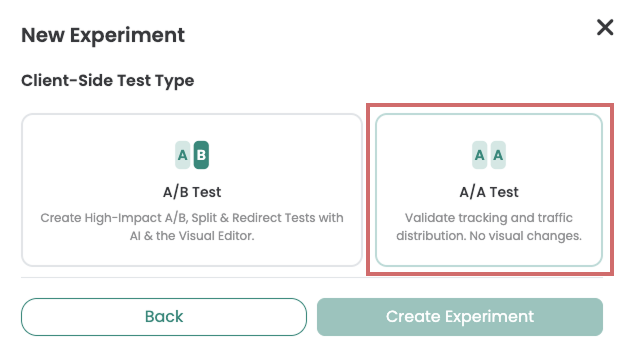
- Now select „A/A Test“
- Now give the A/A test a name
- Enter an experiment URL for the A/A test (your domain is already set as the default here)
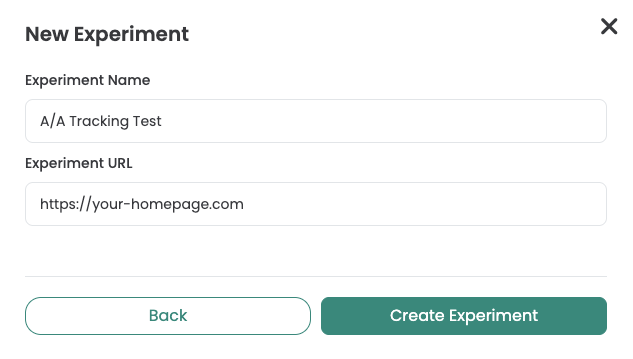
- Save the A/A test by clicking „Create Experiment“
- Start the A/A test by clicking „Start Experiment“
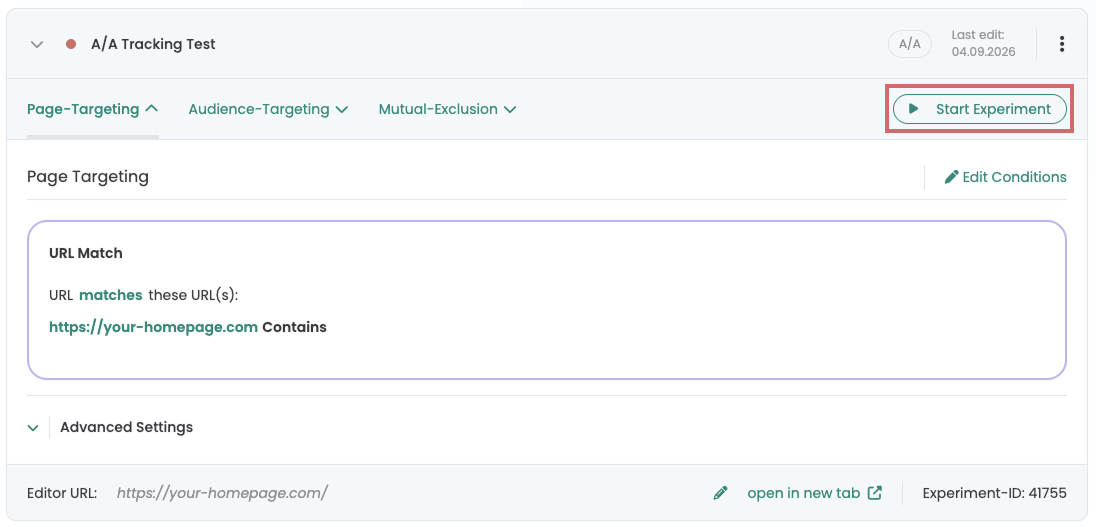
By default, the A/A test is set to a „Contains“ match in Page Targeting to collect as much data as possible for testing the tracking. You can edit the targeting for the A/A test via "Edit Conditions.".
2. Test Playback Verification
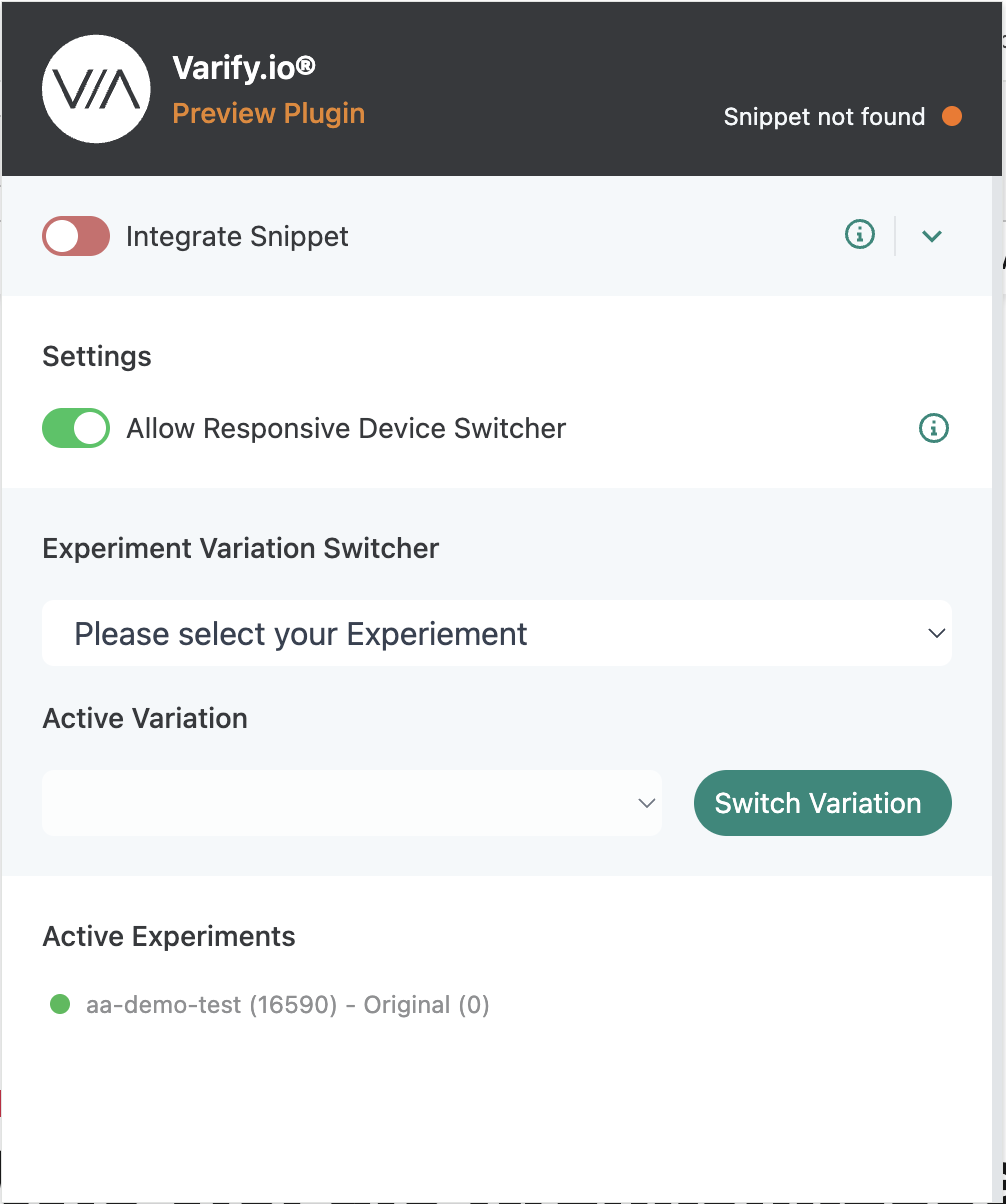
- go to any page on your website and check whether the AA test is being delivered. The easiest way to do this is to open the Varify Google Chrome Browser Extension and check that the AA test is listed under „Active Experiments.“ (It may take up to 2 minutes after the test goes live for you to see the experiment. Please refresh the page as needed.)
3. Check live events in GA4
Once the Varify snippet has been integrated, tracking has been set up and an A/A test has been started, you can check in the GA4 Realtime Overview whether the events of your A/A test are arriving.
- In GA4, go to the Realtime Overview under Reports.
- Search for the widget "Event count by Event Name".
- Check whether an event called "Abtesting" appears (you may have to click through the pages of the widget).
- Click on this event to open the parameters.
- Check whether the parameter "varify_abTestShort" is available (you may have to click through the pages of the widget).
- Click on the parameter and check whether the parameter consisting of Experiment ID and Variant ID is displayed correctly
If this parameter is visible and correct, the tracking is set up correctly.
(Optional) Check varify events in DataLayer
If no live events are visible in GA4, you can check in the developer console of your browser whether the Varify tracking events are being pushed correctly into the DataLayer.
This is how you proceed:
- Open a page on which your A/A test is active.
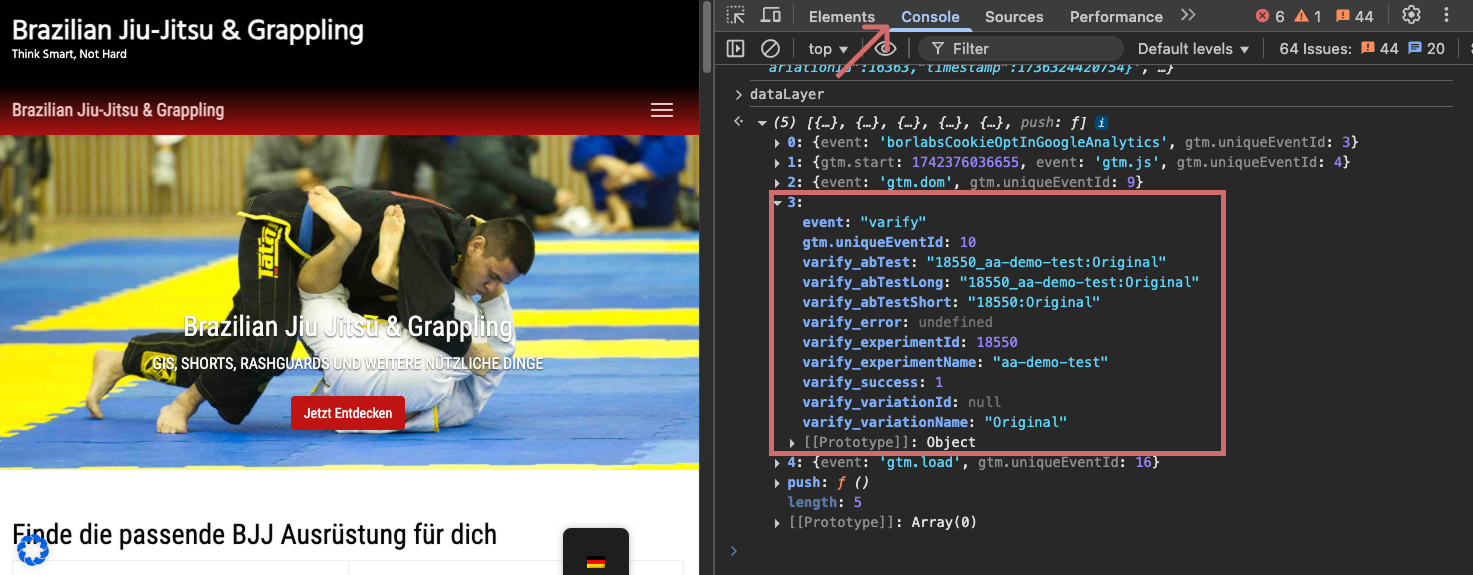
- Open the developer console of your browser: In Chrome: Right-click on the page → "Inspect" → select the "Console" tab.
- Write dataLayer into the console and press enter.
- Search the DataLayer for an event with the name "varify".
- Unfold the event - here you will find all relevant parameters and information about the experiment, e.g:
Name of the experiment
Variant you are in
Important Information on the Interpretation of A/A Tests
How to carry out an A/A test correctly
An A/A test deserves the same level of care as a regular A/B test. Plan for a test duration of at least one week or up to about 1,000 conversions per variant, whichever comes first. Choose a primary metric and don’t evaluate the test until the predetermined time. If there’s no significant difference at the end (p > 0.05), you can assume that your setup is working correctly.
Use events instead of metrics or key events
In A/B testing, the primary focus is typically on whether a user achieves a goal. GA4 traditionally measures this not on a per-user basis, but on an event basis; thus, a user can trigger a goal (an event) multiple times. However, metrics and key events cannot be analyzed on a “once per user” basis via the GA4 API; this is a limitation of the GA4 API itself. Automated tests or bots can trigger events particularly frequently. If such a bot happens to land in only one variant, this significantly skews the comparison. Therefore, always perform the analysis on an event basis, using the “Exclude duplicate user events” setting, so that a goal is counted at most once per user.
Less is more: choose metrics wisely
Avoid analyzing too many metrics at once. The more metrics you consider, the higher the likelihood of so-called false positives—that is, seemingly significant differences that don’t actually exist. Here’s an example: With 14 metrics, the probability of at least one false positive is about 51 percent, even if you use a 5 percent significance level for each individual metric. So it’s more likely to detect a false positive than not to detect one.
Important: Don't peek too early
Repeated interim tests can also greatly distort the significance of your test. This is because each additional look at the results increases the probability of incorrectly interpreting a random result as significant.
- 7 interim tests (for example, daily over the course of a week): about a 30 percent risk of a false positive
- 14 interim tests (for example, daily over a two-week period): approximately a 51 percent risk of a false positive
Conclusion: Don't end your test until the scheduled time, even if it seems like „something happens“ before then. If you stop too early, you risk making the wrong decision based on a false positive.